Inflationary Pressures in Housing

PREAInflationHousing scaled e1660248223923
June 1, 2021 Affordable Housing Real Estate Market Trends Strategic Planning Inflation

Originally published in PREA Quarterly Magazine

Housing prices have increased in 2020 and 2021 at some of the fastest rates seen in many years. Inflationary pressures have been felt most in the single-family sector, as the multifamily market was negatively impacted by the COVID-19 pandemic in some areas. Although the pandemic exacerbated many of these inflationary trends, a fair number were already present before the pandemic started.

Prior to the pandemic, the new-home market in the US was undersupplied as a result of buyer, builder, and lender caution in the wake of the global financial crisis. After the initial pandemic shutdown eased, consumers responded to being stuck at home with an increased desire for more space in preferred locations, quickly depleting suburban and rural inventories. Low inventories and strong demand led to strong price appreciation. Those high prices have somewhat moderated the strength of housing demand in recent months, although both new and existing home prices are up substantially on a year-over-year basis, and demand remains strong. The inflationary impacts from strong home demand and price appreciation are expected to influence shelter inflation (a component of the Consumer Price Index) through 2022.

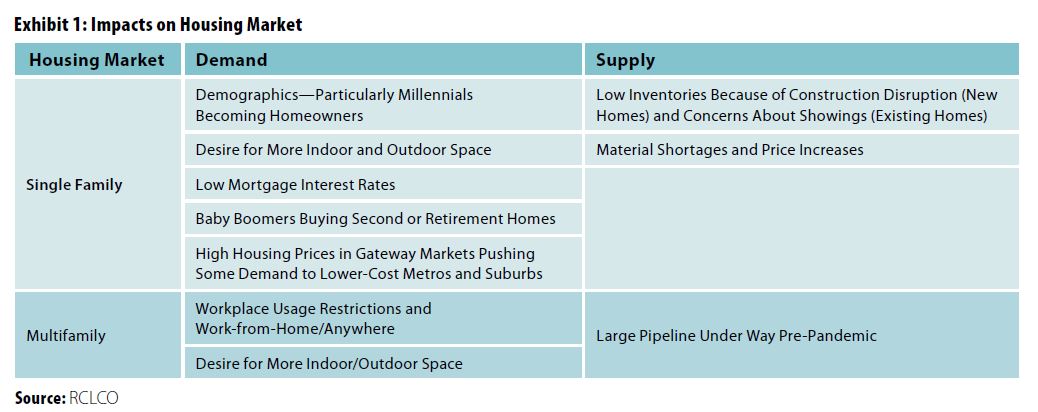
Exhibit 1 summarizes the main factors impacting the US housing market in recent years. Some of these are long-term trends (e.g., demographics), and others are related to the pandemic and likely to dissipate over time.

Chart showing impacts on housing market

This article focuses on the factors causing inflationary pressure in the housing sector, looking at long-term trends as well as pandemic-influenced changes, and prospects for future market conditions. Overall, strong home price appreciation is the result of undersupplied housing. Price appreciation is likely to remain strong, although the pace of price increases will moderate in the second half of 2021 and into 2022 as home builders increase production and mortgage forbearance programs end.

Major Inflationary Drivers

Demographics
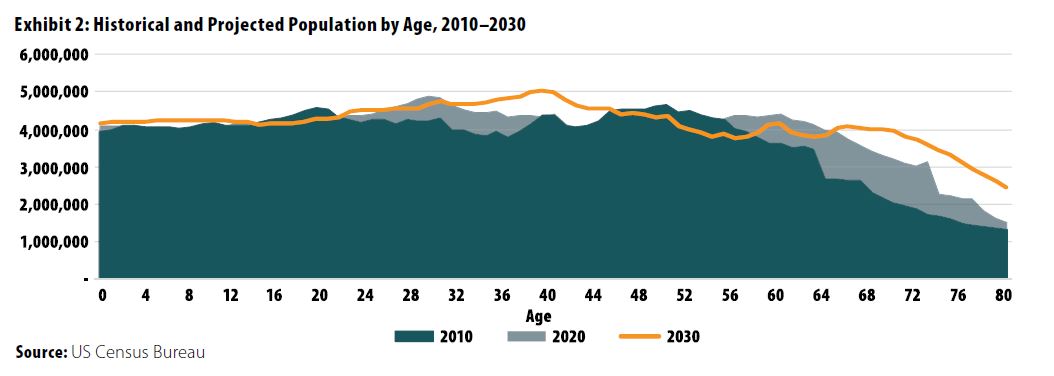
The main demographic story of the past ten years and the next ten has been and will be the larger millennial cohort supplanting the smaller Generation X in the prime household-forming age categories. Although there are no hard-and-fast guidelines, many demographers peg the millennial generation as people born between 1980 and 1995. Thus, we are talking about a group aged 25 to 40 in 2020 and aged 35 to 50 in 2030. Over the ten years ending in 2030, millennials will be a fast-growing cohort (Exhibit 2) and continue in large numbers to form households and families. Though their housing preferences (urban/suburban/rural, single/multifamily, owner/renter) will be diverse, a large percentage will likely prefer single-family housing, ensuring that the demand for that housing type will remain strong. The era of millennial housing demand was already upon us prior to the pandemic and is expected to continue boosting demand for the rest of the decade.

Chart showing historical and projected population by age, 2010-2030

Low Interest Rates
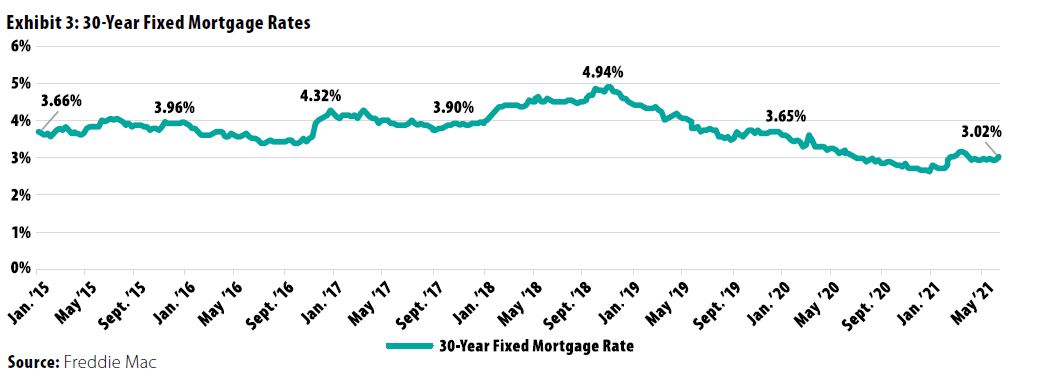
Mortgage interest rates are a big driver of for-sale housing demand. Interest rates dropped to record low levels during the pandemic, driving additional housing demand (and the ability to afford larger and more expensive houses). Though rates started to rise in early 2021, they have been falling for the past few months (as of July 2021) and may fall further if Treasury rates continue to fall (Exhibit 3). We have no crystal ball as to future mortgage rates, but if they stay below the average of the past decade, upward pressure will be exerted on housing prices.

Chart of 30 year fixed mortgage rates

Desire for More Space
When the pandemic shut down many workplaces and public gathering places, many households had an increased desire for more space (both indoor and outdoor) at their homes. This led some households to move to find that space. Suburbs were the beneficiary at the expense of urban areas, with some individuals and households moving to smaller cities or even exurbs in search of more space at lower prices or rents. Because more households have been seeking larger homes and homes in specific places, low housing inventory in those areas has been exacerbated, driving up prices.

Changing Location Preferences
There was already a shift in housing location preferences before the pandemic, favoring suburban areas and rural and semirural areas. At the same time, many cities, such as Austin, Nashville, and others, continued to attract new residents. The pandemic appears to have accelerated the movement to suburban and rural areas as well as to more-affordable urban areas. There is significant debate as to whether the bulk of those moving to exurbs will stay permanently, but it is likely that many will, particularly if employers increasingly allow telecommuting. On the other hand, others will return to cities as offices, entertainment venues, and retail open up in cities.

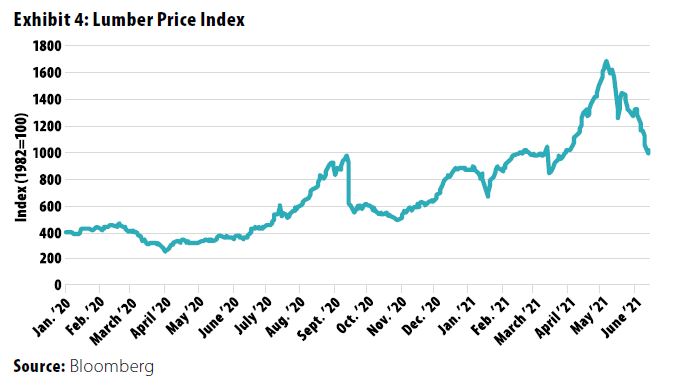
Chart showing lumber price index
Chart showing inflation in construction materials compared to all materials

Material Shortages and Cost Pressures
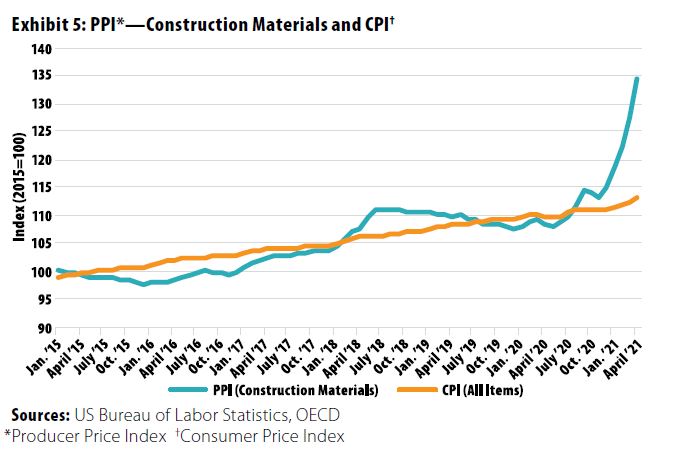
Houses are constructed from a wide range of materials, with many systems (heating, plumbing, etc.) and appliances. The cost of almost all those components has gone up since the COVID-19 pandemic started. In addition, land prices have gone up as a consequence of high demand and limited supply because some land developers initially slowed their activity during the pandemic and then could not keep up as demand rapidly increased. Among housing components, lumber prices received the most attention, as both shortages and spiking prices added to the cost of building new homes. Lumber prices have fallen in recent months (Exhibit 4) but are materially higher than levels prior to the pandemic. Lumber accounts for approximately 25% to 30% of housing construction costs (not including land), and prices of other construction materials have also risen faster than inflation over the past year (Exhibit 5). Going forward, supply chain disruptions for construction materials should be resolved over the next one to two years, resulting in lower material costs in the years ahead.

Chart showing existing home sales

Low Inventories
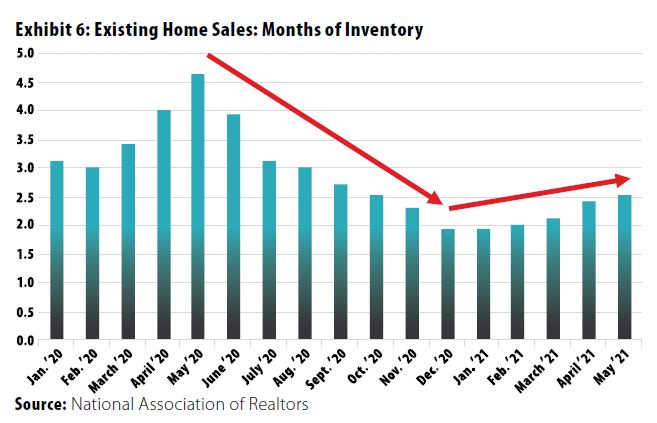
A well-functioning housing market needs enough inventory for supply and demand to remain in relative balance. New housing inventory, recently at about five months at the current sales rate, and resale housing, at an even tighter 2.5 months, have both been in tight supply (Exhibit 6). In addition, constraints in the supply of components, i.e., appliances, framing lumber, plywood, windows and doors, and well-located building lots, have contributed to reduced inventories. Prior to the global financial crisis, the housing industry typically maintained higher levels of inventory, which allowed for greater consumer choice. Since the financial crisis, the market has shifted to lower-than-typical inventories. Now, with major demographic shifts pushing new home demand, low inventories are leading to shortages and outsized price increases.

Chart of median home sales price 2015-2021
Chart of average new home sales price 2015-2021

Result—Robust Housing Price Inflation

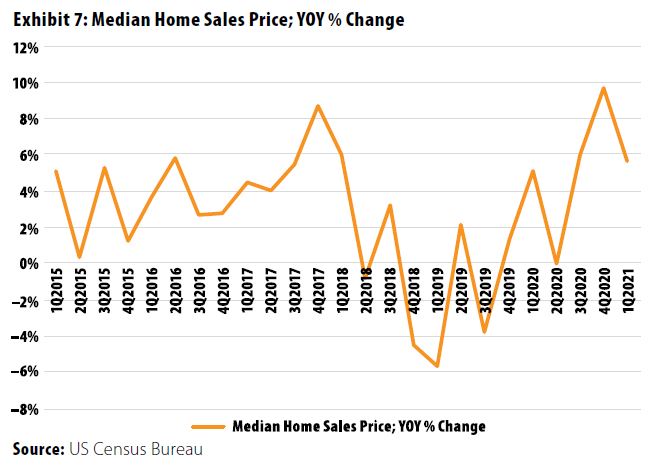
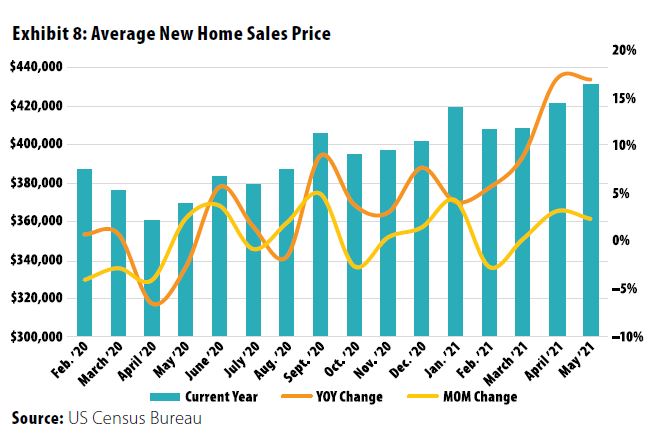
The combination of strong demand, low interest rates, low inventories, and rising material costs has led to strong overall home price appreciation for existing homes, reaching almost 10% year-over-year (YOY) in the fourth quarter of 2020, before falling to 5.6% YOY in the first quarter of 2021 (Exhibit 7). Prices of new homes have been rising even faster—17% YOY as of May 2021 (Exhibit 8). Clearly, these rates of growth are not sustainable and will likely moderate as more buyers get priced out of the market, more new homes are built, existing homeowners decide to become sellers, and mortgage forbearance programs come to an end.

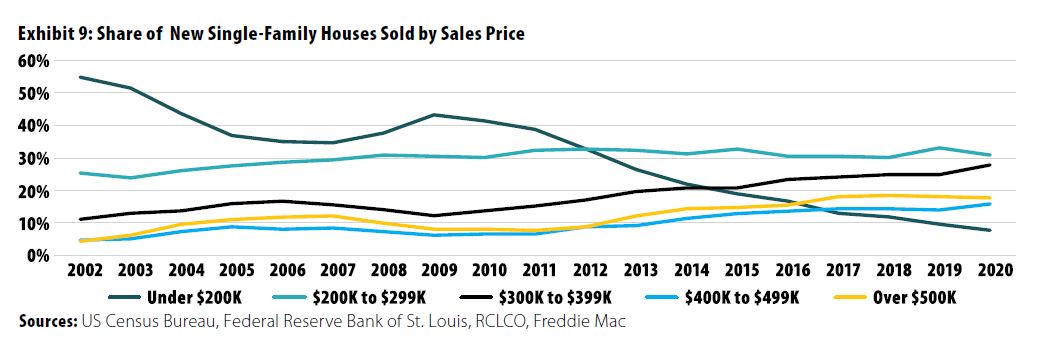
Chart of Share of new single-family houses sold by sale price 2002-2020

Other Impacts

One impact of rising home prices has been a big shift away from the construction of moderately priced housing. In part, this is caused by rising land and construction costs but also higher government fees and greater restrictions. As shown in Exhibit 9, the share of homes priced under $200,000 fell to only 8% of all single-family homes in 2020 from more than 50% in 2002. These higher prices were somewhat offset by lower mortgage interest rates, but overall affordability has declined over the past few decades.

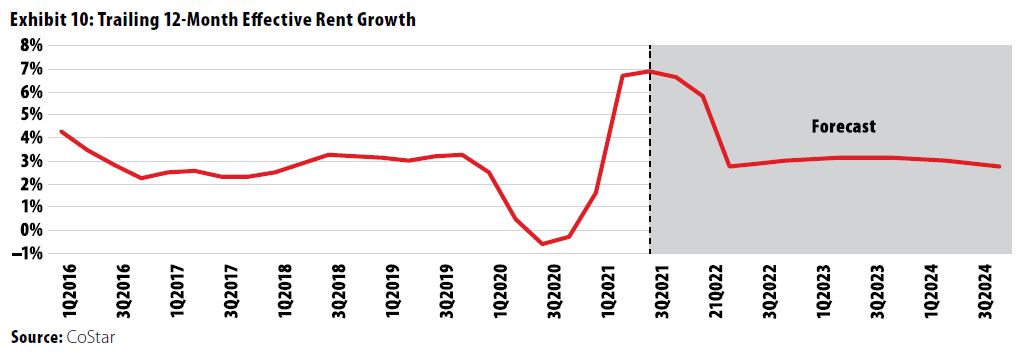
Chart of trailing 12 month effective rent growth 2016-2024

Apartment Impact and Trends

The impact of COVID-19 on the US apartment market was deep and long lasting but not expected to be severe. Overall, apartment rents fell in the second and third quarters of 2020 but have started to rebound since then. As shown in Exhibit 10, trailing 12-month rent levels turned negative in mid-2020 but rebounded in the first quarter of 2021, and CoStar forecasts a return to equilibrium in mid-2022.

Although the national average rents showed little distress, the impact of COVID-19 was much greater in the most expensive apartment markets, such as New York City and San Francisco. Many young professionals who were forced to work remotely decided to do so from their parents’ homes or from lower-priced cities. This caused big declines in occupancy rental rates in those markets. However, as of mid-2021, many residents appear to be returning to urban areas and rental rates are starting to recover in most markets.

Summary

Most housing market observers expect that over the next two years, the current supply chain constraints should gradually be resolved, more residential resellers are likely to emerge because of high prices and the reduced COVID-19 concerns, and the single-family market will move closer to equilibrium. Recent surveys show that consumer sentiment has already shifted toward a seller’s market, given strong residential appreciation trends. Variables to watch out for, with the potential to mitigate demand, are rising prices and interest rates. Just as owners see this as a good time to sell, many potential buyers are expressing concerns about an overheated market. As of mid-2021, new home sales are slowing as a result of rising prices, and inventories have grown slightly. Underlying demographic trends and likely low interest rates will support continued strong demand for the rest of the current economic expansion, with home price appreciation moderating closer to the 5%-plus range than the recent double-digit growth. Apartment demand and rent growth will also move closer to historical levels, although there could be some softness in the high-rent markets if office usage declines or workers shift to lower-cost cities.


Disclaimer: Reasonable efforts have been made to ensure that the data contained in this Advisory reflect accurate and timely information, and the data is believed to be reliable and comprehensive. The Advisory is based on estimates, assumptions, and other information developed by RCLCO from its independent research effort and general knowledge of the industry. This Advisory contains opinions that represent our view of reasonable expectations at this particular time, but our opinions are not offered as predictions or assurances that particular events will occur.

Speak to One of Our Real Estate Advisors Today

We take a strategic, data-driven approach to solving your real estate problems.

Contact Us

Sign Up For Our Newsletter