Interactive Data
RCLCO has developed many different visualization tools that enable you to better interact with regional data regarding types of neighborhoods, area rankings based on product types, and the impacts of transit and mobility on pricing. Click on and explore some of these maps below.
-
 October 12, 2023
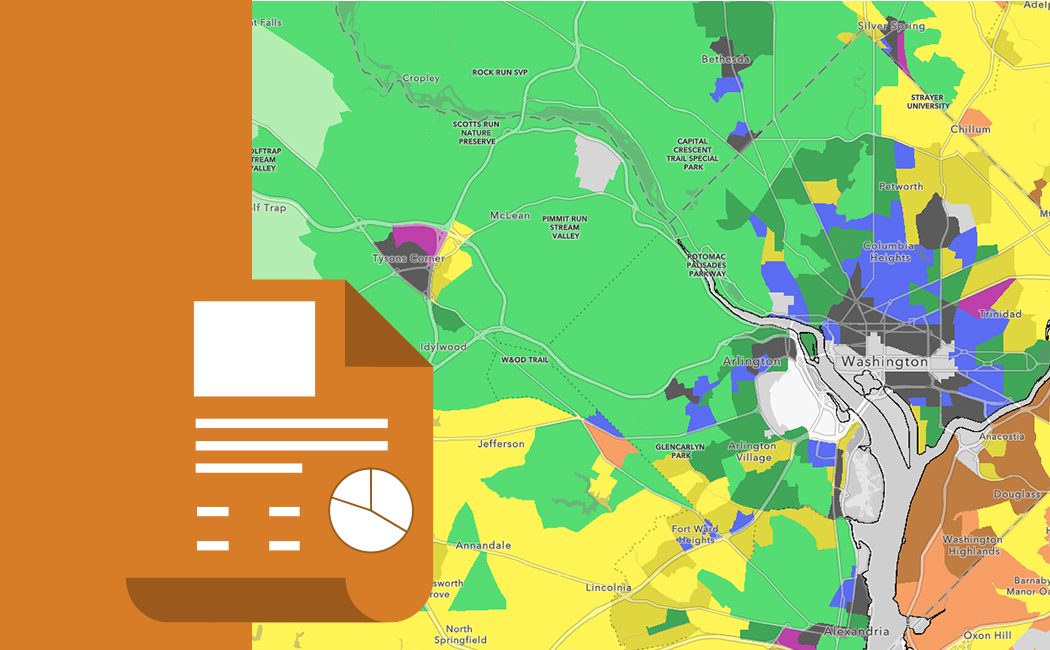
The Updated Neighborhood Atlas
Urban Housing Trends Suburban HousingRCLCO is happy to announce an update and expansion to its Neighborhood Atlas. Originally created in conjunction with the ULI Terwilliger Center for Housing, the Neighborhood A...
read more
-
May 1, 2023
Housing Progress Interactive Index
Housing Demand Real Estate Market TrendsRCLCO and the ULI Terwilliger Center for Housing have collaborated to develop the Housing Progress I...
read more -
March 22, 2023
RCLCO Neighborhood Atlas: Urban & Suburban Neighborhood...
Urban Housing Trends Suburban HousingWelcome to RCLCO's neighborhood atlas, a new, interactive visualization of U.S. suburban & urban...
read more -
August 9, 2022
Interactive Map of the Top-Selling Master-Planned Communitie...
For-Sale Housing Master-Planned CommunitiesFollowing the release of RCLCO's report, The Top-Selling Master-Planned Communities of 2021, RCLCO h...
read more -
March 10, 2022
Explore the 2021 Second-Home Consumer Research Survey Result...
Consumer Insights Resort Vacation Homes Second HomesNearly two years into the Covid-19 pandemic, we have seen exceptionally strong performance in the se...
Read More -
April 27, 2021
RCLCO’s Data Visualization Toolkit & Insights for the...
Real Estate Market Trends InteractiveA question that we often hear is “How is technology and big data impacting the real estate industr...
Read More -
March 17, 2021
Tracking Urban and Suburban Apartment Performance
Multifamily Urban Housing TrendsAs we hit the first anniversary of COVID, the time feels right to dig in and understand what’s rea...
Read More -
October 8, 2020
Honey I Shrunk the Apartments: Average New Unit Size Decline...
Multifamily Urban Housing TrendsIn the time period 2010-2014 average unit sizes decreased 7.6% compared to units delivered between 2...
Read More -
September 10, 2020
Which Grocery Store Anchor Drives the Strongest Apartment Pe...
Multifamily Urban Housing Trends RetailOver the past two decades, the presence of Whole Foods in a neighborhood has functioned as an unmist...
Read More -
July 16, 2020
Jobs Across America: An Interactive Map of Employment Densit...
Demographic TrendsRCLCO is excited to announce the release of its new interactive data tool, “Jobs Across America,�...
Read More -
January 29, 2019
Building Opportunity: Mapping Gentrification and Investment ...
Real Estate Investing Strategic PlanningWhile regulations for opportunity zone investments have yet to be wholly finalized, real estate inve...
Read More -
April 26, 2018
The Impact of Mobility on Apartment Rents
Urban Housing Trends Real Estate Market TrendsAn important shift in how the real estate industry understands location and evaluates sites is the c...
read more -
February 1, 2017
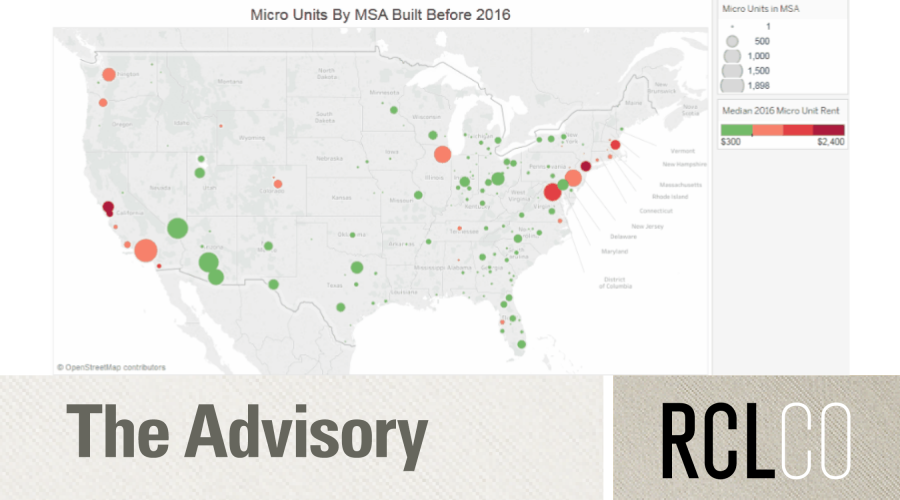
Bigger Units, Bigger Payday: Exploring and Mapping the Growt...
urban real estate Real Estate TrendsThe “micro unit” trend—shrinking unit sizes to maintain more affordable rents, while achieving...
read more -
October 13, 2016
Is Smaller Getting Bigger? Visualizing Micro Units Across th...
Multifamily urban real estate Anchor InstitutionSince collaborating with the Urban Land Institute on The Macro View on Micro Units report in 2014, R...
Read More