Saving Tax Dollars with Compact Development

How and where growth occurs plays an important part in local economies, the environment, and a community’s character. Who pays for that new growth and how local revenues maintain any related new infrastructure and additional services are just as critical. By way of example, one fire station in a walkable neighborhood of a city may be able to service thousands of residents and employees who are clustered together and connected by a gridded street network. By contrast, a suburban area in the same city has the same number of residents and employees but they are spread farther apart due to lower density, separated land uses, and a less connected road network. Because more land is consumed and road access is constrained, the suburban area requires two fire stations to satisfy local response times necessary for health and life safety. The difference in the two places illustrates that while everyone in the city pays the same tax rate, fire service areas vary in how much they cost to serve depending on how the areas are built out.
In partnership with Smart Growth America, RCLCO has created a Cost of Services Tool, which has found in several test cases across the nation that a more compact development pattern costs a jurisdiction less to service per capita than less dense suburban or exurban development. Investing in compact development and infill projects that improve our urban cores not only helps to create walkable live-work neighborhoods, but can offer communities a growth strategy that is supportive of development while saving taxpayers money.
Cost of Services Approach
When studying the fiscal impact of new development on a jurisdiction, the most common method in use is an average cost approach model. The average cost method assumes that each new household or employee in the community is generating the same additional costs as the overall average for the area in question. In reality, we know that some new development may be located in infill locations or close to existing infrastructure and generate marginal new costs while other suburban development may be less centrally located and need extensive infrastructure investments in order to service it.
Our fiscal impact model demonstrates the resulting costs from several different development patterns. In order to inform inputs to the model, GIS (geospatial) data was used to analyze existing conditions in several municipalities in detail by overlaying a ¼ square mile grid. The outputs of the analysis are the varying costs of providing and maintaining roads, water and sewer, fire protection, and school bus service in different development patterns.
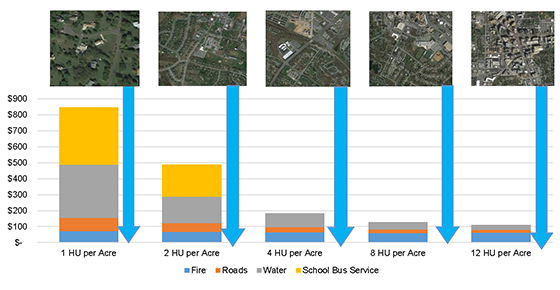
For example, our model predicts that in a sample jurisdiction, moving from 1 unit per acre to 12 units per acre reduces certain categories of per capita costs by approximately $700 because of efficiencies gained in servicing more compact development. Our Cost of Services Tool produced similar results in Nashville, Tennessee; West Des Moines, Iowa; Macon, Georgia; Indianapolis, Indianapolis; and Madison, Wisconsin.
Annual per Capita Costs by Housing Density
Note: Above 2 housing units per acre, school bus service cost declines to zero because all students are assumed to be in the walk zone.
SOURCE: RCLCO, Google Earth
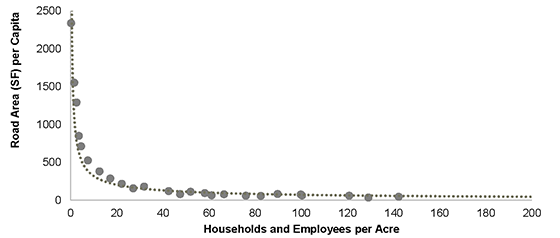
As an example of the data at a more granular level, we performed an analysis on the data found in the ¼ square mile grid to analyze how road area varies per capita in a sample jurisdiction. As shown below, compact development results in less road area per capita, which has a positive fiscal and environmental impact.
Road Area per Capita and Density
SOURCE: RCLCO, ArcGIS
Our findings on cost savings from compact development for roads are similar to those in “PlanMaryland.” Maryland’s Department of Planning compared growth scenarios from 2010 thru 2030. Under current conventional suburban development patterns, about 4,800 road miles would be required at a cost of $20.2 billion dollars, while the more compact “smart growth” pattern would require about 1,800 road miles, at a cost of $7.8 billion dollars. This constituted a construction saving from compact development of approximately $12.4 billion dollars, or $620 million dollars per year.[1]
An additional, less quantifiable, benefit of compact development is the conservation of open space. Compact development offers the potential to increase overall tax revenues to a jurisdiction by saving land for future development, maintains local agricultural and working lands economies, and provides scenic beauty that contributes to a community’s quality of life.[2]
Planning and Policy Implications
The results in communities where we ran the model confirm the hypothesis that it is more cost efficient to install, operate, and maintain infrastructure and provide certain services where development patterns favor compact growth over conventional suburban growth. We have also discovered that many communities do not consider cost efficiencies when planning for growth and development, leaving taxpayer money on the table. Our research and tool indicates that as a matter of policy, all communities—and particularly those that are budget-conscious—may want to consider including the cost implications of development patterns when planning for new growth.
Contact RCLCO if you want to learn more about the tool or are interested in having the tool implemented in your community. Contact Lee Sobel at lsobel@rclco.com or 240.380.3102.
[1] Fiscal Impact Analysis; Analyzing the Effects of Smart Growth on Projected Road Development. Choi, Kenneth, Ph.D, and Fricke, Christopher A., Maryland Department of Planning. 2010. http://www.mdp.state.md.us/PDF/OurWork/FiscalImpact_RoadProjection.pdf
[2] Ibid. Research on the economic benefits of natural and working lands to communities is extensive. For a sample see Economic Benefits of Farmland Preservation: Evidence from the United States. Lynch, Lori, and Duke, Joshua M., Department of Agriculture and Resource Economics. University of Maryland. 2007. See also, Conservation: An Investment That Pays; The Economic Benefits of Parks and Open Space. Gies, Erica. The Trust for Public Lands. 2009.
Article and research prepared by Lee Sobel, Principal, and Kelly Mangold, Senior Associate.
RCLCO provides real estate economics and market analysis, strategic planning, management consulting, litigation support, fiscal and economic impact analysis, investment analysis, portfolio structuring, and monitoring services to real estate investors, developers, home builders, financial institutions, and public agencies. Our real estate consultants help clients make the best decisions about real estate investment, repositioning, planning, and development.
RCLCO’s advisory groups provide market-driven, analytically based, and financially sound solutions. Interested in learning more about RCLCO’s services? Please visit us at www.rclco.com/expertise.
Disclaimer: Reasonable efforts have been made to ensure that the data contained in this Advisory reflect accurate and timely information, and the data is believed to be reliable and comprehensive. The Advisory is based on estimates, assumptions, and other information developed by RCLCO from its independent research effort and general knowledge of the industry. This Advisory contains opinions that represent our view of reasonable expectations at this particular time, but our opinions are not offered as predictions or assurances that particular events will occur.
Related Articles
Speak to One of Our Real Estate Advisors Today
We take a strategic, data-driven approach to solving your real estate problems.
Contact Us


