Demographic Trends Support Robust Multifamily Demand
The strong recovery in the multifamily housing industry, especially relative to the weaker recovery in single-family housing, has caught the attention of many observers. Some see in this fast recovery the first indications of a new “bubble,” while others view it as evidence of an inevitable shift in preference towards more urban living and away from the single-family home in the suburbs. The explanation has significant implications for multifamily housing developers, owners, and investors.
We analyzed historical data and future population projections from the U.S. Census Bureau to shed light on the situation and found that, at least on the broad national scale, the data does not support concerns over a multifamily bubble. In fact, it indicates that demand for multifamily housing (including rental and for-sale) may be even more robust over the next four years than it was during the boom years of 2000 to 2007. Even without assuming a major change in preference for multifamily housing, two key demographic trends, described below, should drive demand for multifamily housing above what might be expected from population growth alone.
- The weak economy has created a situation of “pent-up” demand for housing, especially among young people, who are the most important demographic for multifamily housing. Unable to find adequate employment, many have decided to remain in their parents’ homes or live with roommates. If the labor market continues to recover, we expect them to revert to their pre-recession behavior, meaning that many of the household formations that would have happened over the last three to four years in a “normal” economy will now happen over the next few years.
- The marriage rate in the U.S. has declined steadily for decades and shows no signs of abating. As a result, the number of single and unmarried households has risen and will likely continue to rise at a rate faster than the growth in population. This trend favors multifamily housing because unmarried households have consistently shown a higher propensity than married households to live in multifamily housing.
After taking account of these two factors and population growth, this analysis suggests that the demand for new multifamily housing should range from 280,000 to 460,000 units per year. The low end of this range assumes that preferences shift back slightly towards single-family homes as the economy recovers and that there is currently excess vacancy that will meet some of the future demand. The high-end estimate assumes that there is no current excess vacancy and that the preference for multifamily housing within age and marriage categories as of 2011 remains the same in the future. To put these estimates in perspective, the U.S. averaged about 300,000 multifamily housing starts per year from 2000 to 2007.
A couple of cautionary notes are warranted. First, this analysis only considers broad national trends in the United States. Local supply, demand, and demographics may be significantly different. Second, the actual quantity of units that will be constructed in the future depends not only on demand driven by demographics, but on many other factors. The demand estimates presented here should not be interpreted as a development forecast, but rather as one element to consider when thinking about such a forecast.
Age, Marital Status, and Multifamily Housing Demand
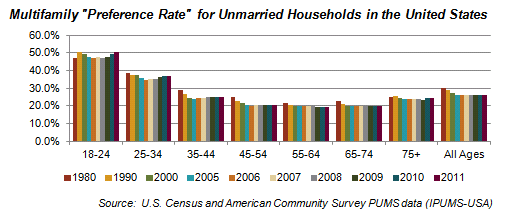
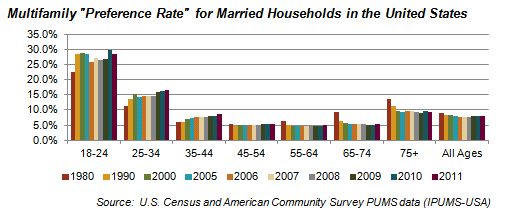
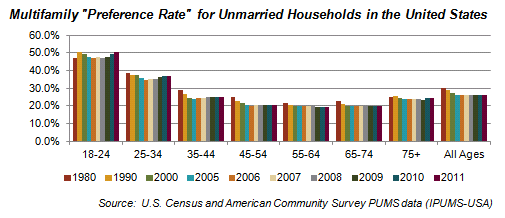
We hypothesized that the overall preference for multifamily versus single-family units can be reliably predicted based on the marital status and age of the householder. The charts below present the evidence for this argument. They show the percentage of total households in the U.S. that live in multifamily housing units (5 or more units per structure) within age and marital status categories. Overall they have remained quite consistent, especially over the last decade, for both married and unmarried households.
Nonetheless a slight uptick in the multifamily “preference rate” is visible over the last three years, especially for 25-34 year olds. Whether this reflects a permanent shift in preference towards urbanity, or a cyclical impact of the economic downturn that has pushed many households into the rental market after the boom years of the early 2000s, is unclear. It may be a combination of both.
Marriage rates have shown an unambiguous trend. As shown in the chart below, the rate of marriage, for virtually all ages, has fallen continuously since 1980.
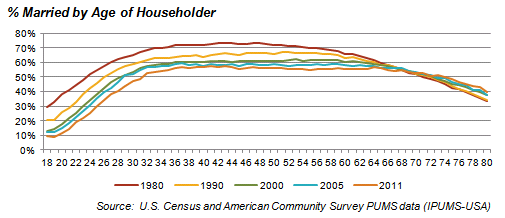
If this trend continues, it implies a greater demand for multifamily housing than that generated by population growth alone, because unmarried householders are more likely to choose multifamily housing, at every age.
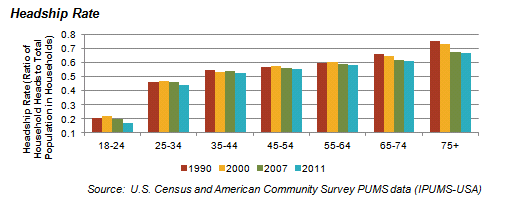
An additional key factor that affects demand for not only multifamily housing, but all housing, is the rate of household formation, which is typically measured by the headship rate. This is the ratio of the heads of households in a given age group to the total population in that age group. For people over the age of 65, headship rates declined steadily from 1990-2007. This trend is most likely explained by the increasing life expectancy of the U.S. population. As spouses live longer, the proportion of people living alone also decreases, and headship rates decline as a result. For the younger age groups, headship rates remained much steadier from 1990-2007. But from 2007 to 2011 there was a noticeable decline in the headship rate in the 18-24 and 25-34 age groups. This decrease is likely explained by the weak labor market during and after the recession. Without jobs, or with lower paying jobs, young people especially have chosen to stay with their parents or live with roommates to minimize costs. While these declines in headship rates may appear insignificant, when applied to the entire population of the U.S. they can mean a large difference in the number of households, and therefore housing demand.
Future Demand Could Exceed 400,000 Units per Year
We constructed two scenarios of future demand through 2017 based on the above factors and using the following assumptions:
- Population growth by age group is based on projections of the U.S. Census Bureau.
- Headship rates for all age groups under the age of 65 will return to their 2007 levels by 2017. This projection is based on the assumption that the economy, and labor markets, will continue to heal and, as they do, household formation rates will recover. Headship rates for the 65-74 and 75+ age cohorts will continue to decline at the same average annual rate that they declined from 2000-2011, on the assumption that life expectancies will continue to increase.
- The marriage rate for each age group is assumed to decrease through 2017 at the same average annual rate that it decreased from 2000-2011. Over all age groups, this means that the percentage of householders that are married would decline from 50.4% in 2011 to 48.1% in 2017.
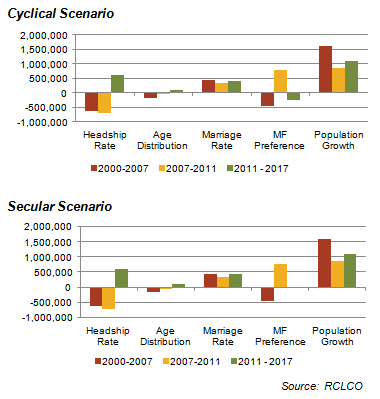
- We tested two scenarios with regard to the multifamily preference rate within age and marital categories—“Cyclical” and “Secular.” The Cyclical scenario is based on the premise that the recent uptick in demand for multifamily units has been driven by the economic cycle, and that, as the economy improves, some households will revert to single-family living. The Secular scenario assumes that the recent uptick in preference for multifamily represents a more permanent shift in preference. Therefore, in the Secular scenario the preference rates for multifamily living within age and income categories are assumed to not change.
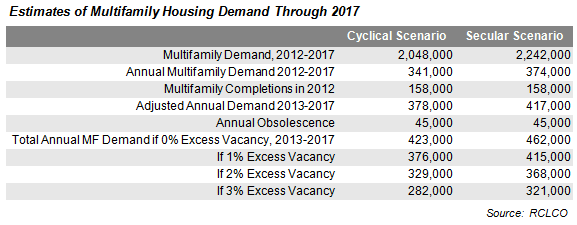
 Under the Cyclical scenario, total demand for an additional 2.048 million units is projected from 2012 through 2017, which equates to an annual pace of 341,000 units. However, because only 158,000 units were delivered in 2012, a somewhat higher pace of 378,000 units per year would be needed from 2013- 2017. Even this estimate, under the more conservative preference rate assumption, results in higher demand for multifamily units than the average annual completions during the 2000s.
Under the Secular scenario, demand for 2.24 million new units is projected from 2012 through 2017, which equates to an annual pace of 374,000. After adjusting for completions of only 158,000 in 2012, the annual pace needed to reach 2.24 million new units by 2017 is 417,000.
The Cyclical and Secular scenario charts summarize the contribution to demand under each scenario of each of the following factors: headship rates, the age distribution of the population, marriage rates, the “preference rates” for multifamily after taking account of age and marital status, and population growth.
Obsolescence
The above demand estimates do not account for the needed replacement of existing units that become obsolete. Good data on the rate of obsolescence is not available, but it is possible to estimate this factor using U.S. Census data which tracks the year built of housing units. Using this source, we estimate that 0.20% of the multifamily housing stock, or about 45,000 units, are replaced each year. This estimate is close to the 0.25% replacement rate for all housing assumed by Harvard’s Joint Center for Housing in its forecast for 2010-2020.
Current Vacancy
The above estimated demand for 378,000 to 417,000 units per year also assumes that there is no slack, or excess vacancy, in the current inventory that might absorb some of this demand. Based on the most typical indicators of vacancy, that appears to be a fair assumption. As of 2012, The Census housing vacancy survey estimates the vacancy rate of the multifamily rental inventory to be 9.3%, approximately in line with the average during the 1990s and slightly below the average vacancy rate from 2000-2010. The same survey estimates the vacancy rate for multifamily “homeowner” units to be 6.9% in 2012, higher than the average of 6% during the 1990s, but the lowest since 2005. Reis, which surveys the multifamily rental market in the United States, estimates a vacancy rate of 4.5% as of 2012—a very healthy level that does not suggest oversupply. Another source, the American Housing Survey, reports total vacancy, excluding seasonal units, of 14.7% in 2012, hardly changed from the 2003 rate of 14.6%, but slightly higher than the 13.3% rate in 1997. The American Community Survey, on the contrary, indicates an elevated vacancy rate of 16.4% for all multifamily units in 2011 as compared with 10.6% in the 2000 Census and 13.1% in 1990. These American Community Survey and Census estimates, however, use a broad measure of vacancy that counts seasonal units as vacant.
The inconsistency between the sources certainly leaves room for debate. However, because most sources do not suggest vacancy significantly out of line with past averages, we are inclined to believe that the “excess vacancy” is unlikely to be more than 2% to 3% of existing inventory. The table below shows the range of annual demand estimates under the Cyclical and Secular scenarios after accounting for obsolescence and excess vacancy ranging from 0% to 3% of the existing multifamily inventory.
Related Articles
Speak to One of Our Real Estate Advisors Today
We take a strategic, data-driven approach to solving your real estate problems.
Contact Us


