Bigger Units, Bigger Payday: Exploring and Mapping the Growth of Macro Units

The “micro unit” trend—shrinking unit sizes to maintain more affordable rents, while achieving a rent per square foot that still supports new construction—has made headlines over the last several years. Previous issues of the RCLCO Advisory have included an interactive analysis showing where these units are located and when they were built and showed just how much and why average unit sizes have shrunk compared with last cycle.
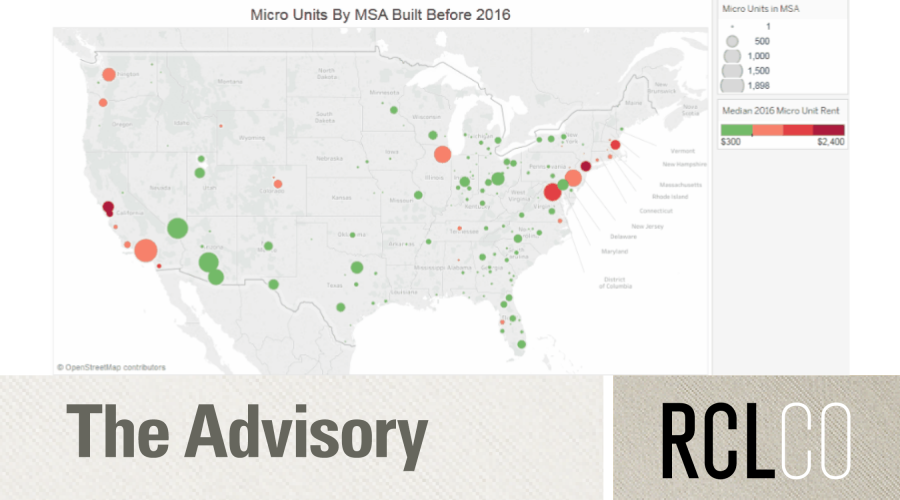
But while the industry overall has shifted towards smaller units, some developers have moved in the opposite direction and differentiated their communities by building large units, both in bedrooms and square feet. We dub these “macro units.” Some of them are being rewarded with higher per-square-foot rents than the smaller units within the same development. We mapped these over 16,260 macro units across the nation. See below for a nationwide map of each location with at least one macro unit. Larger circles indicate more macro units in the location. Read on to explore how we have defined these units.
//
Where Are Macro Units?
RCLCO analyzed nearly 5,000 apartment developments delivered since 2011, with over 60,000 floorplans and just over one million units, to statistically determine the units that are significantly larger than a typical unit; we call these “macro units.” We analyzed this “big data” through a series of Tukey boxplots.[1]
Average Unit Size of Apartment Communities Delivered since 2011—How to Read a Boxplot

SOURCE: Axiometrics
Unit Size Distribution among Units Delivered since 2011

SOURCE: Axiometrics
By MSA, Houston is the top MSA, beating New York by 136 units.
//
While macro units exist across the nation, they are not just one-off penthouse units. To zero in on communities that have made a decision to focus on the macro unit market, we included only buildings where at least 25% of their units are considered macro statistical outliers. Please click around on the interactive map to find your market and the locations with the most macro units. When you hover over a city, a popup will display the city name, number of macro units in the city, the percentage of units in the identified developments that are macro units, and the average size of those units.
//
Critical Success Factors for Macro Units
RCLCO set out to understand the typical characteristics of macro unit communities where larger units achieve higher rents per square foot than smaller units. These communities not only retain their value ratio as unit sizes increase, they achieve higher rents per square foot as unit sizes in their community increase. In other words, while a 1,000-square-foot unit might rent for $2,000, a 2,000-square-foot unit would rent for at least $4,000.
Through detailed analytics, we took the hundreds of communities that achieve higher rents per square foot as the units get larger and filtered to those with statistically significant positive relationships between unit size and rent per square foot and average unit sizes of at least 1,000 square feet.[2] This resulted in 30 examples of macro unit developments delivered since 2011. See below for an example of this linear regression model for Roasters Block Swofford in Kansas City, Missouri. The relationship between unit size and rent per square foot is described by the $ PSF= line that is charted on the graph. A detailed description of this statistical model is in endnote [2].
Statistical Analysis—Linear Regression Model for Roasters Block Swofford

SOURCE: Axiometrics
Some key facts about these communities:
- The unit counts of these communities vary from 43 to 540. The average unit count of these communities is 194, smaller than the average community size of 217 units.
- These communities have very few studios—on average less than 5% of the units. They are heavily weighted towards one- and two-bedroom units, with one-bedrooms comprising 44% and two-bedrooms comprising 40% of the unit mix. Finally, three-bedroom units make up 11% of these communities.
- Greystar manages the highest number of these communities—20% of those profiled.
- Not all units are created equal. While a community overall may have a positive relationship between unit size and achieved rent per square foot, these relationships are partially driven by unit type, with two- and three- bedroom units experiencing a positive relationship between unit size and rent per square foot while one-bedrooms typically had a flat or negative relationship.[3]
Beyond the numbers, some defining features of these communities include:
- 100% locations—these communities are either located in the heart of downtown neighborhoods or in established high-end suburbs. Among the 30 profiled communities, 37% are in the downtown core, 30% are in established high-end suburbs, and the remaining communities are in downtown-adjacent neighborhoods or near institutions such as a military base or university.
- Walkable proximity to retail—communities are typically mixed-use and several feature high-end ground floor grocers such as Whole Foods. Neighborhood amenities, including coffee shops, drug stores, and restaurants, are within walking distance.
- Some offer differentiation within the community—upper floors or floors with premium views often feature upgraded appliances and features, including gas ranges, wine storage, and electric fireplaces.
- Features and amenities are more luxurious than the rest of the local rental market. Nearly every community includes comprehensive pet amenities because many households with the means for large units at high value ratios own pets.
- Service—nearly every community on the list includes 24-hour concierge service. Concierge services often include dog walking and other services not offered by the typical concierge.
While the majority of these communities target empty-nester move-downs, and young professionals not ready to own, a few communities focus on family-friendly amenities. These communities are top-of-market within their area and are located where families often live in rental product (e.g., near military bases or are in urban locations such as Manhattan).
End Notes: On Advanced Analytics and Statistical Methodology
[1] Tukey boxplots were developed by mathematician John W. Tukey in 1969. We are using the boxplot to chart the distribution of floorplans in communities delivered since 2011. In this example, “micro” and “macro” units can be more precisely defined as small and large outlier units. In a Tukey boxplot, macro unit outliers are those units which are units larger than the 75th percentile of unit size plus 1.5 times the size difference between the 25th and 75th percentile—otherwise known as the interquartile range. For the example in the average unit size by community chart, the 25th percentile is 858 square feet and the 75th percentile is 1,054 square feet, meaning the interquartile range is 182 square feet. A macro outlier is defined as a unit which is 1,054+1.5*182 square feet—or larger than 1,327 square feet. Using this methodology, macro units comprise 1.7% of total units built since 2011.
[2] To determine the relationship between unit size and value ratio, RCLCO conducted a linear regression on the floorplan level for each community delivered since 2011. An example of this linear regression is shown below for Kent Place Residences in Englewood, CO.
Statistical Analysis—Linear Regression Model for Kent Place Residences

Note that the linear trend line is positive. In the trend line equation, the $ PSF calculation can be read as for each additional square foot a unit in this community has, the rent per square foot of the unit is increased by just over .02 cents. This may not seem like a lot, but in this example a 1,000-square-foot unit would rent for $1.83 per square foot while a 1,500-square-foot unit would rent for $1.95 per square foot; the nominal rent for the hypothetical 1,000-square-foot unit would be $1,830 compared with $2,925 for a 1,500-square-foot unit.
To determine statistical significance, RCLCO analyzed the linear trend’s p-value. In this example, the p-value is less than .05, meaning the relationship between unit size and rent per square foot is significant at a 95% confidence interval. It is also important to note that the R-Squared value of the linear trend line indicates that 27% of Kent Place Residences’ rent per square foot can be explained by the unit size.
The lines above and below the linear trend are the 95% confidence intervals—showing that the linear trend is more robust where there are multiple floorplans around the same unit size while it is less significant when the trend extrapolates without as much data, such as below 600 square feet and above 2,000 square feet.
Of the nearly 5,000 rental apartment communities delivered since 2011, RCLCO identified 440 communities that have a positive relationship between unit size and achieved dollar per square foot. Of those 440, RCLCO identified 72 communities where the positive relationship was statistically significant at a 95% confidence interval. Finally, RCLCO identified 30 of these 72 remaining communities as “macro” communities because they have average unit sizes of 1,000 square feet or larger.
[3] While communities may have positive relationships based on unit size, the relationship does not necessarily hold across different unit types. At The Easton on the Upper East Side of Manhattan, while two- and three-bedroom units experience a positive relationship between unit size and rent per square foot, one-bedroom units have the opposite relationship. For readability, the confidence intervals were removed in the following linear trend example chart.
Statistical Analysis—Linear Regression Model by Bedroom Type for The Easton

Disclaimer: Reasonable efforts have been made to ensure that the data contained in this Advisory reflect accurate and timely information, and the data is believed to be reliable and comprehensive. The Advisory is based on estimates, assumptions, and other information developed by RCLCO from its independent research effort and general knowledge of the industry. This Advisory contains opinions that represent our view of reasonable expectations at this particular time, but our opinions are not offered as predictions or assurances that particular events will occur.
Related Articles
Speak to One of Our Real Estate Advisors Today
We take a strategic, data-driven approach to solving your real estate problems.
Contact Us


